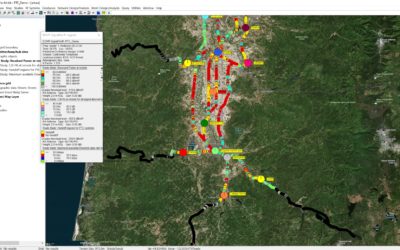
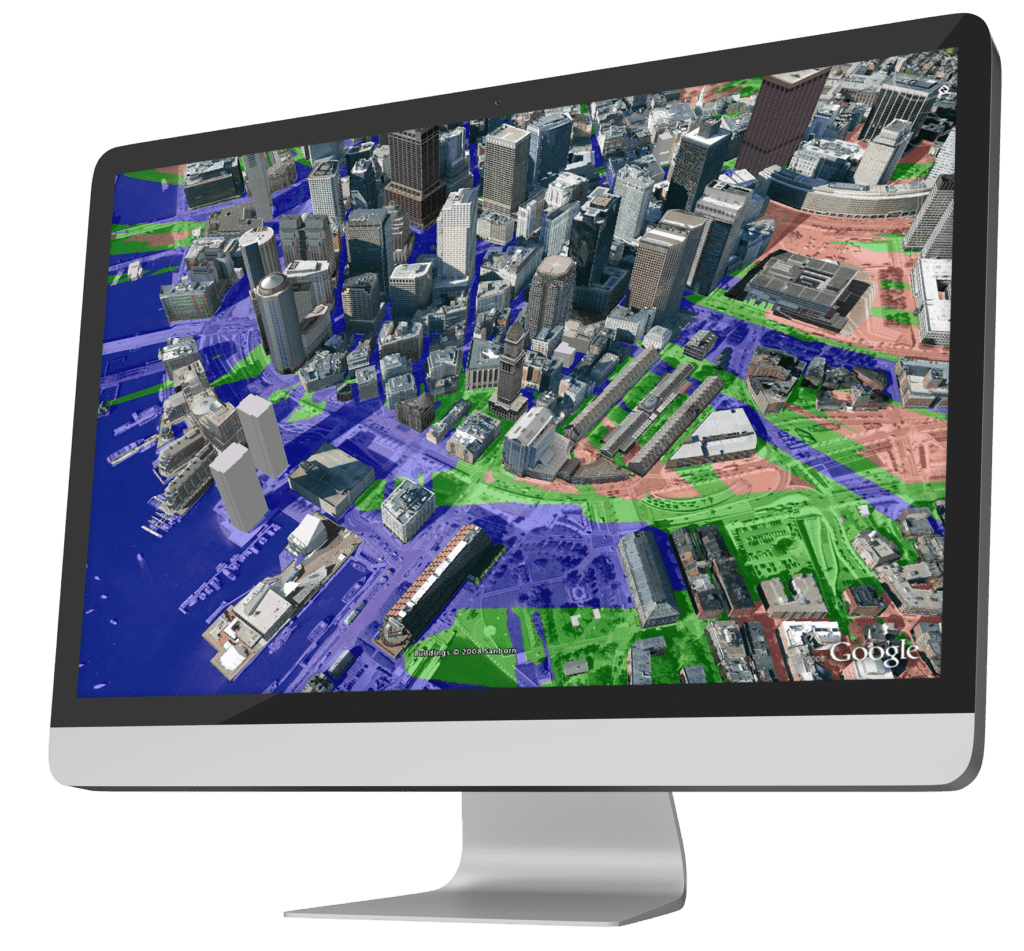
Area studies (also called coverage plots, heat maps, etc) are the most commonly used, and one of the best indicators of network performance. An area study provides a predicted value for each point within a user-defined Study Grid. These studies show coverage, interference and other KPIs in a service area and can be used for network design, optimization, visualization and presentations.
When using SignalPro, your projects can contain as many area studies as you wish. There are many ways in which to customize your study results and outputs.
- Transmitters may be put into groups, and particular studies run to particular transmitters and transmitter groups
- You may configure as many mobile/remote units as you wish, with studies run to each unit as to compare UE performance
- Study visualization can be customized with various display types and color schemes. Transparency levels can also be configured to see real world coverage over service area maps
- Signal display thresholds can be set to show only the points which meet your particular received power level
- Area studies can be exported to various formats eg GoogleEarth, MapInfo, ESRI shp and PDF
- Queries allow users to break down the percentage of a service area’s coverage and each site’s contribution to overall coverage. Population counts may be included in these queries.
- There are many more parameters that can be configured in area studies including reliability methods, exclusion boundaries, propagation model customization and much more.
Note that technology specific studies are available in the 5G, LTE-PRO, Mesh, and LoRa Modules. The standard studies available in SignalPro are:
- Shadowing
- Pathloss
- Minimum RMS Delay Spread
- Field Strength
- Received Power
- Received Voltage
- C/(I+N) at Receiver/Remote/Mobile Unit
- C/(I+N) Ratio
- Bit Error Rate (BER) at Receiver/Remote/Mobile Unit
- Strongest (Most Likely) Server
- Uplink Field Strength
- Uplink Received Power
- Uplink Received Voltage
- Bit Error Rate at Best Base from Remote
- Areas with Signal levels above both base and remote thresholds
- C/I Ratio – Primary Group TXs to Second Group TXs
- Percent Availability
- Percent Log-Normal Reliability
- Aggregate Power Flux Density
- Simulcast RMS Delay Spread
- Shadow Areas from Satellite
- Number of Servers at Remote
- Number of Base Receivers with Power Above Threshold
- Data Rate using Custom Table
- Minimum Remote Height required for LOS
- Percent Log-Normal Reliability for voting receivers
- Number of servers within capture ratio
- TSB88 Monte Carlo Bounded Area Coverage
- TSB88 Radius-of-operation overlap reliability
- Aggregate Simulcast Monte Carlo Reliability
- Simulcast Delay Spread (“Hess”)
To learn more about configuring area studies or to discuss which studies are most appropriate for your application, book a customer success session